 2548
2548
 2018-03-05
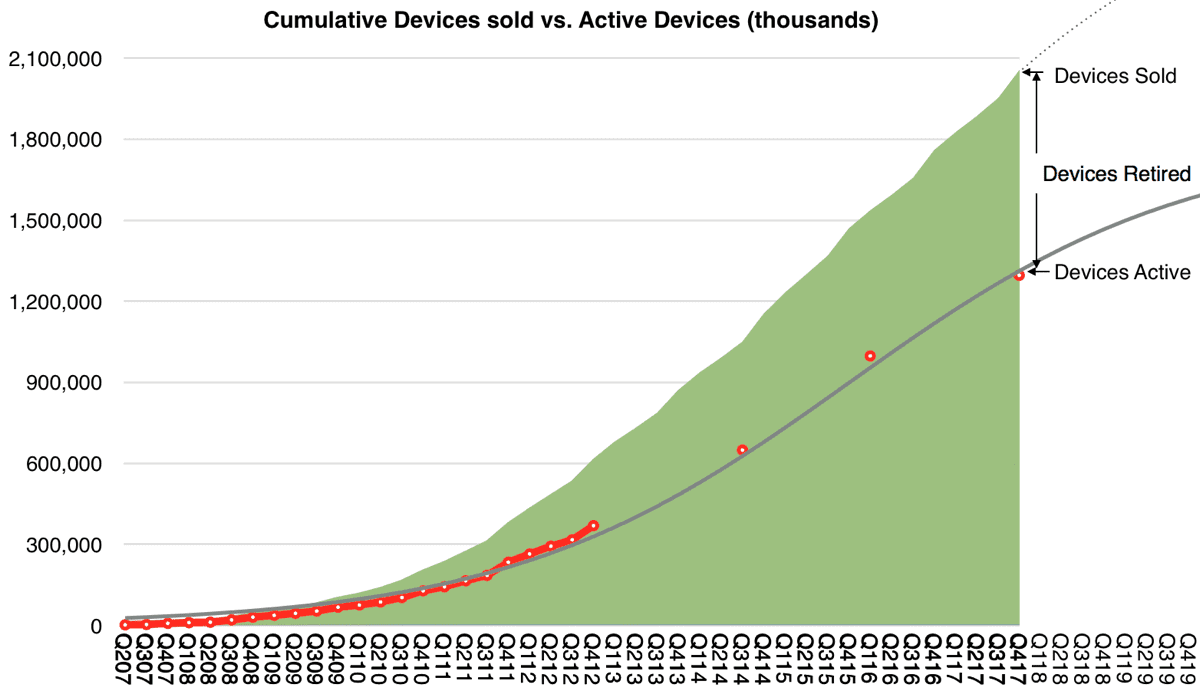
Two out of three Apple devices ever sold are still in use, according to Asymco. Horace Dediu arrived at this number by taking the total number of monthly active devices and comparing it to the total number of devices sold. But it’s not just about the number of devices, it’s also about customer satisfaction.

The Number
Dr. Edward Deming, a statistician, said that “the numbers that best define a company are…the value of a satisfied customer and the value of a dissatisfied customer.” And these numbers difficult to quantify.
Apple sends out satisfaction surveys to customers and that is what the company measures . But Horace points out that people tend to lie and say things that they judge the listener will want to hear, in an effort to be liked more.

So to get around that, he created a formula to chart Apple devices: S÷(1+EXP(−1×(t−o)÷g)) where S is the point of saturation or maximum population size, t is the period or count of quarters (1 for Q1 2007 and 2 for Q2 2007, etc), o is the offset to 50% or the point of inflection, in quarters, and g is the growth factor. The S-curve in the chart corresponds to S=1.8 billion, o=35 and g=8.
Once you have an estimate of the active device (user) base size, you can use to to predict units sold and revenue. The conclusion is the ratio between cumulative units and active units, which gives us the number 64%. This is the percentage behind the “2 out of 3 Apple devices sold are still in use” rule of thumb.
This is the number you use to predict Apple’s business. It’s a better satisfaction measurement than surveys, because raw data doesn’t lie. And presumably you can chart this into the future to make predictions, which is what good science is about.
Source: macobserver